
Using Website Analytics to Improve User Experience: Your Data-Driven Playbook
Last month, I watched a client’s conversion rate jump from 2.1% to 7.3% in just three weeks. No fancy redesign. No expensive marketing campaign. Just smart website analytics and the willingness to listen to what the data was screaming.
Here’s the thing about user experience analytics, It’s like having a crystal ball, but better. Because instead of guessing what might happen, you’re seeing exactly what is happening on your site right now. Every click, every scroll, every frustrated exit tells a story.
Today, we’re diving deep into the world of website data tracking and how it can transform your user experience from “meh” to “wow”, this just works.” Whether you’re a startup founder trying to understand why users aren’t converting or a freelancer looking to prove your UX improvements actually work, this guide will change how you think about data.
What Is Website Analytics and Why Should You Care?
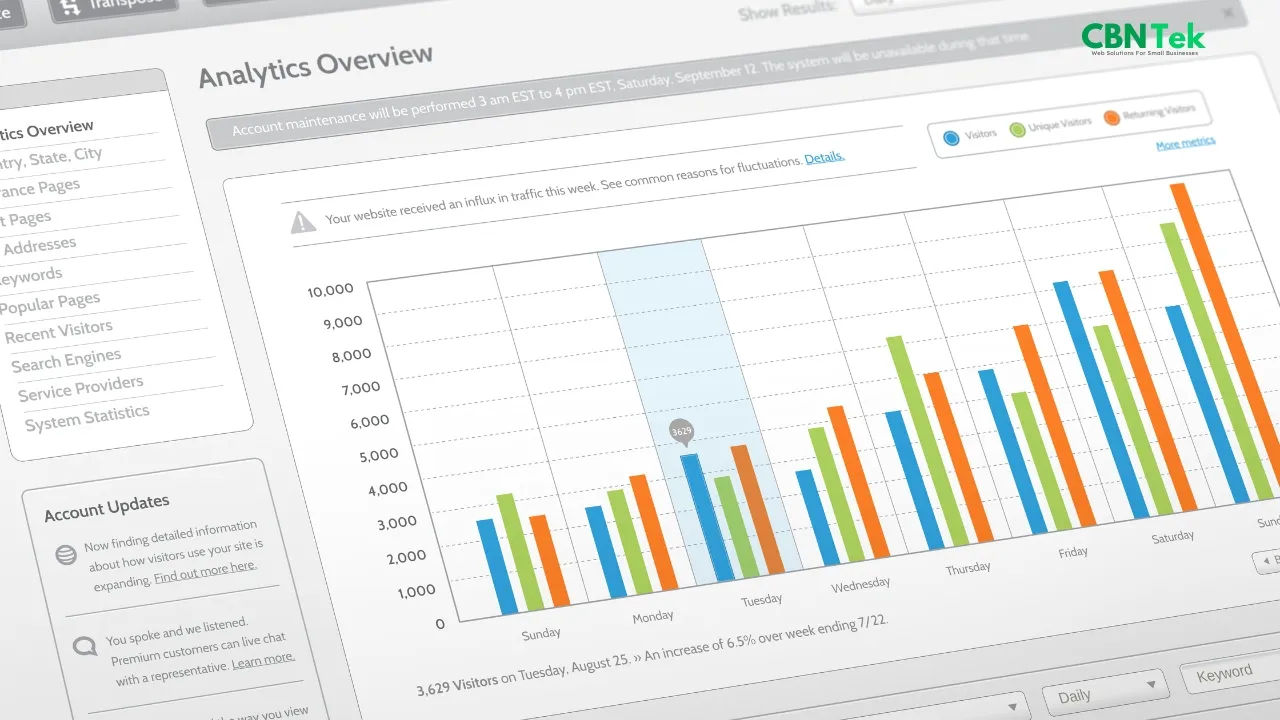
Think of website analytics as your website’s health monitor. Just like a fitness tracker shows your steps, heart rate, and sleep patterns, web analytics tools reveal how users interact with your digital space.
But here’s where it gets interesting: website analytics isn’t just about counting visitors anymore, but It’s about understanding the human behavior behind every data point.
How Website Analytics Actually Works
When someone visits your site, analytics tools place a tiny piece of code (like a digital detective) that follows their journey. It tracks:
- Where they came from
- What pages they visit
- How long they stay
- Where they click
- When they leave (and why)
This creates a behavioral fingerprint that reveals patterns invisible to the naked eye.
I remember working with an e-commerce client who was convinced their checkout process was perfect. The analytics dashboard told a different story. 73% of users were abandoning their carts at the shipping information step. One simple form field adjustment later, and cart abandonment dropped to 31%.
Why Website Analytics Is Your Secret Weapon for Business Growth
Let me be blunt: running a website without analytics is like driving blindfolded. You might get somewhere, but it won’t be pretty.
Website analytics answers the questions that keep business owners up at night:
- Why are visitors leaving so quickly?
- Which marketing channels actually work?
- What content resonates with my audience?
- Where are my conversion bottlenecks?
The Business Impact You Can Measure
Improved User Experience: When you know where users struggle, you can fix it before they give up.
Higher Conversion Rates: Data reveals exactly which elements drive action and which ones create friction.
Better ROI: Stop wasting money on marketing channels that don’t convert. Double down on what works.
Competitive Advantage: While your competitors guess, you’ll know. That’s powerful.
Essential Metrics That Actually Matter for User Experience
Not all metrics are created equal. I’ve seen too many business owners get lost in vanity metrics while ignoring the data that actually drives results.
The Core UX Metrics to Track
Bounce Rate: The percentage of visitors who leave after viewing just one page. High bounce rates often signal UX problems, but context matters. A high bounce rate on a contact page might be good, the users found what they needed quickly.
Average Session Duration: How long users spend on your site. But here’s the twist, longer isn’t always better. Sometimes a short session means users accomplished their goal efficiently.
Pages Per Session: Shows how engaged users are with your content. More pages typically indicate better UX and content relevance.
Conversion Rate: The holy grail metric. The percentage of visitors who complete your desired action.
Exit Rate: Different from bounce rate. This shows where users typically leave your site. High exit rates on specific pages reveal problem areas.
Advanced UX Metrics for Deeper Insights
Time to First Interaction: How quickly users engage with your site. Faster is almost always better.
Scroll Depth: Shows how far down pages users scroll. Essential for content optimization.
Click-Through Rate (CTR): Measures how compelling your calls-to-action are.
Form Abandonment Rate: Critical for lead generation sites. Shows where your forms lose users.
The Best Website Analytics Tools for 2025
Choosing the right web analytics tools is like picking the right lens for a camera, It completely changes what you can see.

Free Tools That Pack a Punch
| Tool | Best For | Key Strengths |
|---|---|---|
| Google Analytics 4 | Comprehensive tracking | Free, powerful, integrates with everything |
| Plausible | Privacy-conscious sites | Simple, GDPR compliant, lightweight |
| Clicky | Real-time insights | Live visitor tracking, immediate data |
Premium Tools Worth the Investment
Hotjar is my go-to for user behavior analytics. The heatmaps and session recordings are like watching over users’ shoulders as they navigate your site. I’ve discovered UX issues in minutes that would have taken months to identify otherwise.
Mixpanel excels at event tracking, perfect for SaaS products or apps where user actions matter more than page views.
Adobe Analytics is the enterprise heavyweight. If you’re managing multiple sites with complex tracking needs, it’s worth the investment.
Setting Up Analytics: The Right Way
Here’s my foolproof setup process for website analytics for beginners:
Step 1: Define Your Goals Before installing any code, know what success looks like. Are you tracking sales? Newsletter signups? Content engagement?
Step 2: Choose Your Primary Tool Start with Google Analytics 4 if you’re unsure. It’s free, comprehensive, and plays well with other tools.
Step 3: Install the Tracking Code Place it in the header of every page. Use Google Tag Manager for easier management.
Step 4: Set Up Goal Tracking Configure conversions for every important action on your site.
Step 5: Create Your Dashboard Build custom reports that focus on metrics that matter to your business.
How Analytics Transforms User Experience
This is where the magic happens. Website analytics doesn’t just measure UX, it improves it.
The Data-Driven UX Improvement Process
Identify Problems: Use analytics to spot where users struggle. High bounce rates, low conversion rates, and short session durations are red flags.
Form Hypotheses: Why might users be struggling? Poor navigation? Confusing content? Slow loading times?
Test Solutions: Make changes and measure the impact. A/B testing tools like Optimizely integrate beautifully with analytics.
Measure Results: Did your changes improve the metrics that matter?
Iterate: Rinse and repeat. UX improvement is a continuous process.
Real-World UX Wins Through Analytics
I once discovered through conversion tracking that users were clicking a non-functional element that looked like a button. Adding actual functionality to that element increased conversions by 23%.
Another client’s analytics showed users spending 4+ minutes on their pricing page but rarely converting. Session recordings revealed confusion about which plan included what features. A simple comparison table boosted conversions by 41%.
Understanding Different Analytics Tools and Their Strengths
Not all analytics software serves the same purpose. Here’s how to choose:
Google Analytics vs. Everything Else
Google Analytics is the Swiss Army knife of analytics. Its’ good at everything, great at many things. But it’s not always the best tool for specific needs.
When GA4 wins: You need comprehensive data, have a complex site, or want deep integration with Google’s ecosystem.
When alternatives shine: You prioritize privacy (Matomo), need real-time data (Clicky), or want visual insights (Crazy Egg).
Privacy-Focused Analytics: The New Frontier
With GDPR, CCPA, and growing privacy concerns, privacy-focused website analytics tools are gaining traction.
Fathom Analytics and Plausible offer cookie-free tracking that still provides valuable insights. They’re perfect for businesses prioritizing user privacy while maintaining data-driven decision making.
Advanced Analytics Features That Separate Pros from Amateurs
Once you’ve mastered the basics, these advanced features will supercharge your user experience analytics:
Event Tracking Mastery
Event tracking goes beyond page views to monitor specific user actions:
- Button clicks
- Video plays
- File downloads
- Form submissions
- Scroll milestones
This granular data reveals exactly how users interact with your content.
Cohort Analysis for Retention Insights
Track groups of users over time to understand retention patterns. This is gold for subscription businesses and content sites.
Funnel Analysis for Conversion Optimization
Map your user journey and identify exactly where people drop off. Every funnel leak costs you money.
Attribution Modeling
Understand which touch points contribute to conversions. Not all traffic sources are created equal.
Real-Time Analytics: When Immediate Data Matters
Real-time analytics sounds flashy, but when is it actually useful?
Content Publishing: See immediate response to new content or campaigns.
Technical Issues: Quickly identify and resolve site problems.
Event Monitoring: Track live events, sales, or product launches.
Crisis Management: Monitor traffic spikes and user behavior during unexpected situations.
Tools like Woopra and Clicky excel at real-time reporting, giving you a live pulse on your site’s performance.
Tracking Traffic Sources and Understanding Your Audience
Web traffic analysis reveals not just how many visitors you have, but where they come from and what they want.
The Five Traffic Source Categories
Direct Traffic: Users typing your URL directly or using bookmarks. High direct traffic often indicates strong brand recognition.
Organic Search: Traffic from search engines. This is often your highest-converting traffic because users are actively seeking solutions.
Referral Traffic: Visitors from other websites. Great for understanding your content’s reach and building partnerships.
Social Media: Traffic from social platforms. Typically has lower conversion rates but higher engagement.
Paid Traffic: Visitors from ads. Should have clear ROI tracking to justify spend.
Best Practices for Interpreting Analytics Data
Data without context is just noise. Here’s how to extract actionable insights:
The HEART Framework for UX Metrics
Happiness: User satisfaction and perception Engagement: Level of user involvement Adoption: How many users try new features Retention: Rate of returning users Task success: Completion rate of user goals
This framework helps you interpret data through a UX lens rather than just counting numbers.
Avoiding Common Data Interpretation Mistakes
Correlation vs. Causation: Just because two metrics move together doesn’t mean one causes the other.
Sample Size Matters: Don’t make decisions based on small data sets.
Seasonal Variations: Account for time-based patterns in your data.
External Factors: Consider marketing campaigns, holidays, or industry trends that might skew data.
Privacy Compliance in Analytics: Staying on the Right Side of the Law
Privacy isn’t just about following laws, it’s about building trust with your users.
Key Privacy Considerations
GDPR Compliance: If you have European visitors, you need clear consent for tracking.
CCPA Requirements: California residents have rights regarding their data.
Cookie Policies: Be transparent about what data you collect and why.
Data Retention: Don’t keep user data longer than necessary.
Privacy-First Analytics Setup
Anonymize IP Addresses: Most tools offer this option.
Use Consent Management: Tools like Cookiebot can help manage user preferences.
Choose Privacy-Focused Tools: Matomo and Plausible are built with privacy in mind.
Be Transparent: Clear privacy policies build trust and reduce legal risk.
Mobile and Cross-Platform Analytics
With mobile traffic dominating most sites, mobile app data tracking is crucial.
Mobile-Specific Metrics to Monitor
Mobile Page Speed: Mobile users are less patient with slow sites.
Touch Interactions: Track taps, swipes, and pinch-to-zoom behaviors.
Device and OS Breakdown: Understand your mobile audience demographics.
App Store Performance: If you have an app, track downloads and ratings.
Tools like Amplitude and Mixpanel excel at cross-platform tracking, giving you a complete picture of user behavior across web and mobile.
Creating Actionable Reports That Drive Decisions
The best analytics dashboard is one that immediately tells you what to do next.
Report Structure That Works
Executive Summary: Key metrics and trends at a glance.
Goal Performance: Progress toward your defined objectives.
Problem Areas: Metrics that need attention.
Opportunities: Areas showing positive trends to amplify.
Recommendations: Specific next steps based on the data.
Automation for Efficiency
Set up automated reports for regular stakeholder updates. Tools like Google Analytics and Adobe Analytics offer robust reporting automation.
Configure alerts for significant changes in key metrics. This ensures you catch problems quickly and capitalize on opportunities.
The Future of Website Analytics and UX

The analytics landscape is evolving rapidly. Here’s what’s coming:
AI-Powered Insights
Machine learning is making analytics more predictive and prescriptive. Instead of just showing what happened, tools will increasingly suggest what to do next.
Enhanced Privacy Features
Expect more privacy-first analytics solutions as regulations tighten and user awareness grows.
Real-Time Personalization
Analytics will increasingly power real-time content personalization, creating unique experiences for each visitor.
Cross-Device Journey Mapping
Better understanding of user behavior across multiple devices and touch points.
Your Analytics Action Plan
Ready to transform your user experience through data? Here’s your roadmap:
Week 1: Audit Your Current Setup
- Review existing analytics implementation
- Identify gaps in tracking
- Set up goal tracking if missing
Week 2: Dive Into User Behavior
- Analyze your top traffic sources
- Identify your highest and lowest performing pages
- Set up heatmap tracking on key pages
Week 3: Spot the Problems
- Look for high bounce rate pages
- Identify conversion funnel leaks
- Review mobile performance
Week 4: Plan Improvements
- Prioritize issues based on potential impact
- Create hypotheses for improvements
- Plan A/B tests for key changes
The Bottom Line: Analytics as Your UX Compass
Website analytics isn’t just about numbers, It’s about understanding the humans behind those numbers. Every data point represents a real person trying to accomplish something on your site.
The most successful websites aren’t necessarily the prettiest or the most feature-rich. They’re the ones that understand their users deeply and remove every possible barrier to success.
Your analytics data is trying to tell you a story. It’s showing you where users struggle, where they succeed, and where they give up. The question is: are you listening?
Remember, improving user experience through analytics isn’t a one-time project but it’s an ongoing conversation with your users mediated by data.
Start small. Pick one metric that matters to your business. Dig deep into what it’s telling you. Make one change based on that insight. Measure the results.
Then do it again.
Because here’s what I’ve learned after years of diving into web traffic analysis: the websites that win aren’t the ones with the most data, they’re the ones that act on it.
Ready to turn your analytics into UX gold? Start by contacting us to auditing your current setup using the framework above. Remember, the best insights often come from the simplest questions: where do users struggle, and how can you make their journey smoother?
What’s the most surprising insight you’ve discovered from your website analytics? Share your story, I’d love to hear how data transformed your user experience.










0 Comments